|
|
|
|
Lewis Immigration to Early Virginia
|
Locus Group |
1 |
2 |
3 | |||||||||
|
Locus |
02 | 13 | 20 | 21 | 23 | 33 | 34 | 35 | 36 | 37 | ||
| Lewis Group R1b #6.1 |
DYS # |
3 9 0 |
4 5 8 |
4 4 8 |
4 4 9 |
4 6 4 - 2 |
5 7 0 |
C D Y a |
C D Y b |
4 4 2 |
4 3 8 |
Haplogroup |
| #1 | 1. Walden Lewis Spotsylvania Co VA #49497 [Me] |
25 | 17 | 19 | 31 | 15 | 17 | 35 | 36 | 12 | 12 | R-DF27 |
| 2. Taverner
Lewis Spotsylvania Co VA #447439 [37/37] |
25 | 17 | 19 | 31 | 15 | 17 | 35 | 36 | 12 | 12 | R-M269 | |
| #2 | 3. John Lewis Caroline Co VA #26660 [66/67] |
25 | 17 | 19 | 31 | 15 | 17 | 35 | 36 | 13 | 12 | R-DF27 |
|
#3 |
4. Reuben Kennedy Culpeper Co VA #311607 [37/37] |
25 | 17 | 19 | 31 | 15 | 17 | 35 | 36 | 12 | 12 | R-M269 |
| 5. William Young Page Co VA Other Project [66/67] |
25 | 17 | 19 | 31 | 15 | 17 | 36 | 36 | 12 | 12 | R-M269 | |
| 6. Joseph Lewis Caroline Co VA #230494 [66/67] |
25 | 17 | 19 | 31 | 15 | 17 | 36 | 36 | 12 | 12 | R-M269 | |
| 7. Joseph Lewis Caroline Co VA #515842 [*66/67] *A mismatch at either A or B or both is considered a single mismatch. |
25 | 17 | 19 | 31 | 15 | 17 | 36 | 37 | 12 | 12 | R-M269 | |
| #4 | 8. James Lewis Lincoln Co MO #252469 [35/37] |
25 | 17 | 19 | 30 | 16 | 17 | 35 | 36 | 12 | 12 | R-M269 |
| 9. Yelverton Lewis Woodford Co KY #793881 [66/67] |
25 | 18 | 19 | 31 | 15 | 17 | 35 | 36 | 12 | 12 | R-M269 | |
| 10. Yelverton Lewis Woodford Co KY #39239 [34/37] |
24 | 18 | 18 | 31 | 15 | 17 | 35 | 36 | 12 | 12 | R-M269 | |
| 11. James Lewis Louisa Co VA #22948 [65/67] |
25 | 17 | 19 | 31 | 15 | 16 | 35 | 35 | 12 | 12 | R-M269 | |
| #5 | 12. John Lewis Franklin Co KY #232573 [37/37] |
25 | 17 | 19 | 31 | 15 | 17 | 35 | 36 | 12 | 12 | R-M269 |
| 13. Edmund Lewis Person Co NC #219831 [36/37] |
24 | 17 | 19 | 31 | 15 | 17 | 35 | 36 | 12 | 12 | R-M269 | |
| #6 | 14. James McDonald [36/37] | |||||||||||
| 49497 | Walden
Lewis b. 1774 Virginia d. 1843 Jasper Co MS |
R-DF27 | DF27+, L23+, L278+, L389+, L51+, M269+, M343+, P297+, P310+, P311+, P312+, PF3252-, PF6610-, PF6714-, PF7562-, PF7589-, PF7600-, S1026-, S1051-, S11493-, S11601-, S12025-, S1567-, S16264-, S1688-, S18632-, S18827-, S7721-, SRY2627-, U106-, U152-, U198-, V88-, Y5058-, Z156-, Z16500-, Z17-, Z18-, Z1862-, Z195-, Z198-, Z209-, Z2103-, Z2109-, Z225-, Z251-, Z253-, Z2542-, Z255-, Z2573-, Z295-, Z3000-, Z301-, Z302-, Z326-, Z36-, Z367-, Z381-, Z49-, Z8-, Z8052-, Z9-, M73-, MC14-, M335-, L513-, L584-, L617-, L881-, M1994-, M222-, L408-, L47-, L48-, L371-, L238-, FGC20761-, FGC22501-, FGC3861-, FGC396-, FGC5301-, FGC5336-, FGC5344-, FGC5345-, FGC5351-, FGC5354-, FGC5356-, FGC5367-, FGC5373-, FGC5494-, FGC5798-, L1335-, L2-, L21-, DF41-, DF49-, DF63-, DF81-, DF83-, DF88-, DF95-, DF99-, F2017-, F2691-, F2863-, FGC10516-, FGC11134-, FGC13620-, A1773-, A2150-, A274-, A4670-, A517-, BY2823-, BY2868-, BY575-, BY653-, CTS10429-, CTS11994-, CTS1751-, CTS3386-, CTS3937-, CTS4466-, CTS4528-, CTS5330-, CTS5689-, CTS6937-, CTS7763-, DF103-, DF110-, DF17-, DF19-, DF21-, CTS11567*, FGC14641*, Z296*, Z17300* |
| These genetic calculations were created using the following
variables: 1 generation = 25 years Sample size = 37 markers Mutation Rate = Derived from the Sorenson Database Possibility of Mutation = > 50% <http://www.mymcgee.com/tools/yutility.html?mode=ftdna_mode> |
| FTDNA Configuration - DNA Results Comparison | |||||||||||||||||||||||||||||||||||||||||||
| ID | D Y S 3 9 3 |
D Y S 3 9 0 |
D Y S 1 9 / 3 9 4 |
D Y S 3 9 1 |
D Y S 3 8 5 a |
D Y S 3 8 5 b |
D Y S 4 2 6 |
D Y S 3 8 8 |
D Y S 4 3 9 |
D Y S 3 8 9 - 1 |
D Y S 3 9 2 |
D Y S 3 8 9 - 2 |
D Y S 4 5 8 |
D Y S 4 5 9 a |
D Y S 4 5 9 b |
D Y S 4 5 5 |
D Y S 4 5 4 |
D Y S 4 4 7 |
D Y S 4 3 7 |
D Y S 4 4 8 |
D Y S 4 4 9 |
D Y S 4 6 4 a |
D Y S 4 6 4 b |
D Y S 4 6 4 c |
D Y S 4 6 4 d |
D Y S 4 6 0 |
G A T A H 4 |
Y C A I I a |
Y C A I I b |
D Y S 4 5 6 |
D Y S 6 0 7 |
D Y S 5 7 6 |
D Y S 5 7 0 |
C D Y a |
C D Y b |
D Y S 4 4 2 |
D Y S 4 3 8 |
||||||
| 1 | modal | 12 | 25 | 14 | 11 | 11 | 14 | 12 | 12 | 13 | 13 | 13 | 29 | 17 | 10 | 10 | 11 | 11 | 24 | 15 | 19 | 31 | 15 | 15 | 16 | 16 | 11 | 11 | 20 | 22 | 15 | 15 | 18 | 17 | 35 | 36 | 12 | 12 | |||||
| 2 | Charles- R1b | 12 | 25 | 14 | 11 | 11 | 14 | 12 | 12 | 13 | 13 | 13 | 29 | 17 | 10 | 10 | 11 | 11 | 24 | 15 | 19 | 31 | 15 | 15 | 16 | 16 | 11 | 11 | 20 | 22 | 15 | 15 | 18 | 17 | 35 | 36 | 12 | 12 | |||||
| 3 | John-Fkl R1b | 12 | 25 | 14 | 11 | 11 | 14 | 12 | 12 | 13 | 13 | 13 | 29 | 17 | 10 | 10 | 11 | 11 | 24 | 15 | 19 | 31 | 15 | 15 | 16 | 16 | 11 | 11 | 20 | 22 | 15 | 15 | 18 | 17 | 35 | 36 | 12 | 12 | |||||
| 4 | Lit-Kenn R1b | 12 | 25 | 14 | 11 | 11 | 14 | 12 | 12 | 13 | 13 | 13 | 29 | 17 | 10 | 10 | 11 | 11 | 24 | 15 | 19 | 31 | 15 | 15 | 16 | 16 | 11 | 11 | 20 | 22 | 15 | 15 | 18 | 17 | 35 | 36 | 12 | 12 | |||||
| 5 | Wm-Young R1b | 12 | 25 | 14 | 11 | 11 | 14 | 12 | 12 | 13 | 13 | 13 | 29 | 17 | 10 | 10 | 11 | 11 | 24 | 15 | 19 | 31 | 15 | 15 | 16 | 16 | 11 | 11 | 20 | 22 | 15 | 15 | 18 | 17 | 36 | 36 | 12 | 12 | |||||
| 6 | Jose-Car R1b | 12 | 25 | 14 | 11 | 11 | 14 | 12 | 12 | 13 | 13 | 13 | 29 | 17 | 10 | 10 | 11 | 11 | 24 | 15 | 19 | 31 | 15 | 15 | 16 | 16 | 11 | 11 | 20 | 22 | 15 | 15 | 18 | 17 | 36 | 36 | 12 | 12 | |||||
| 7 | John-Car R1b | 12 | 25 | 14 | 11 | 11 | 14 | 12 | 12 | 13 | 13 | 13 | 29 | 17 | 10 | 10 | 11 | 11 | 24 | 15 | 19 | 31 | 15 | 15 | 16 | 16 | 11 | 11 | 20 | 22 | 15 | 15 | 18 | 17 | 35 | 36 | 13 | 12 | |||||
| 8 | Edm-Pers R1b | 12 | 24 | 14 | 11 | 11 | 14 | 12 | 12 | 13 | 13 | 13 | 29 | 17 | 10 | 10 | 11 | 11 | 24 | 15 | 19 | 31 | 15 | 15 | 16 | 16 | 11 | 11 | 20 | 22 | 15 | 15 | 18 | 17 | 35 | 36 | 12 | 12 | |||||
| 9 | Jams-Lou R1b | 12 | 25 | 14 | 11 | 11 | 14 | 12 | 12 | 13 | 13 | 13 | 29 | 17 | 10 | 10 | 11 | 11 | 24 | 15 | 19 | 31 | 15 | 15 | 16 | 16 | 11 | 11 | 20 | 22 | 15 | 15 | 18 | 16 | 35 | 35 | 12 | 12 | |||||
| 10 | Jas-Linc R1b | 12 | 25 | 14 | 11 | 11 | 14 | 12 | 12 | 13 | 13 | 13 | 29 | 17 | 10 | 10 | 11 | 11 | 24 | 15 | 19 | 30 | 15 | 16 | 16 | 16 | 11 | 11 | 20 | 22 | 15 | 15 | 18 | 17 | 35 | 36 | 12 | 12 | |||||
|
|||||||||||||||||||||||||||||||||||||||||||
| Genetic Distance | |||||||||||||||
| ID | m o d a l |
C h a r l e s - R 1 b |
J o h n - F k l R 1 b |
L i t - K e n n R 1 b |
W m - Y o u n g R 1 b |
J o s e - C a r R 1 b |
J o h n - C a r R 1 b |
E d m - P e r s R 1 b |
J a m s - L o u R 1 b |
J a s - L i n c R 1 b |
|||||
| 1 | modal | 37 | 0 | 0 | 0 | 1 | 1 | 1 | 1 | 2 | 2 | ||||
| 2 | Charles- R1b | 0 | 37 | 0 | 0 | 1 | 1 | 1 | 1 | 2 | 2 | ||||
| 3 | John-Fkl R1b | 0 | 0 | 37 | 0 | 1 | 1 | 1 | 1 | 2 | 2 | ||||
| 4 | Lit-Kenn R1b | 0 | 0 | 0 | 37 | 1 | 1 | 1 | 1 | 2 | 2 | ||||
| 5 | Wm-Young R1b | 1 | 1 | 1 | 1 | 37 | 0 | 2 | 2 | 3 | 3 | ||||
| 6 | Jose-Car R1b | 1 | 1 | 1 | 1 | 0 | 37 | 2 | 2 | 3 | 3 | ||||
| 7 | John-Car R1b | 1 | 1 | 1 | 1 | 2 | 2 | 37 | 2 | 3 | 3 | ||||
| 8 | Edm-Pers R1b | 1 | 1 | 1 | 1 | 2 | 2 | 2 | 37 | 3 | 3 | ||||
| 9 | Jams-Lou R1b | 2 | 2 | 2 | 2 | 3 | 3 | 3 | 3 | 37 | 4 | ||||
| 10 | Jas-Linc R1b | 2 | 2 | 2 | 2 | 3 | 3 | 3 | 3 | 4 | 37 | ||||
|
|||||||||||||||
| -
Infinite allele mutation model is used - Values on the diagonal indicate number of markers tested |
|||||||||||||||
| Time to Most Recent Common Ancestor (Generations) | ||||||||||||||||
| ID | m o d a l |
C h a r l e s - R 1 b |
J o h n - F k l R 1 b |
L i t - K e n n R 1 b |
W m - Y o u n g R 1 b |
J o s e - C a r R 1 b |
J o h n - C a r R 1 b |
E d m - P e r s R 1 b |
J a m s - L o u R 1 b |
J a s - L i n c R 1 b |
||||||
| 1 | modal | 37 | 3 | 3 | 3 | 8 | 8 | 8 | 8 | 12 | 12 | |||||
| 2 | Charles- R1b | 3 | 37 | 3 | 3 | 8 | 8 | 8 | 8 | 12 | 12 | |||||
| 3 | John-Fkl R1b | 3 | 3 | 37 | 3 | 8 | 8 | 8 | 8 | 12 | 12 | |||||
| 4 | Lit-Kenn R1b | 3 | 3 | 3 | 37 | 8 | 8 | 8 | 8 | 12 | 12 | |||||
| 5 | Wm-Young R1b | 8 | 8 | 8 | 8 | 37 | 3 | 12 | 12 | 17 | 17 | |||||
| 6 | Jose-Car R1b | 8 | 8 | 8 | 8 | 3 | 37 | 12 | 12 | 17 | 17 | |||||
| 7 | John-Car R1b | 8 | 8 | 8 | 8 | 12 | 12 | 37 | 12 | 17 | 17 | |||||
| 8 | Edm-Pers R1b | 8 | 8 | 8 | 8 | 12 | 12 | 12 | 37 | 17 | 17 | |||||
| 9 | Jams-Lou R1b | 12 | 12 | 12 | 12 | 17 | 17 | 17 | 17 | 37 | 22 | |||||
| 10 | Jas-Linc R1b | 12 | 12 | 12 | 12 | 17 | 17 | 17 | 17 | 22 | 37 | |||||
|
||||||||||||||||
| -
Infinite allele mutation model is used - Average mutation rate varies: 0.0031 to 0.0031 rates derived by Doug McDonald from the Sorenson database - Values on the diagonal indicate number of markers tested - Probability is 50% that the TMRCA is no longer than indicated |
||||||||||||||||
Prior to 2014, the Time to Most Recent Common Ancestor [TMRCA] in generations was calculated using FTDNA standards which are now antiquated.
The second mutation rate selection uses the FTDNA derived mutation rates. This includes a rate of 0.00399 for the first 12 markers, 0.00481 for markers 13 through 25, and 0.00748 for the markers 26 through 37.Y-Utility: Y-DNA Comparison Utility, Ysearch Mode <http://www.mymcgee.com/tools/yutility.html> 12/2014.
Using the Y-DNA Utility, FTDNA Mode and the specific mutation rates per marker, we have significantly different results.
Calculating distance to MRCA by Generations
A relationship and distance in generations can be calculated by comparing the number of mutations and applying the average mutation rate for a haplotype. I use the following:
Time = Difference / average mutation rate T = [1/37] / .0045 T = .027 / .0045 T = 6 generations |
Hopefully, there will come a non-algorithm type, simple mathematical formula which allows us to input the mutation rate for individual markers to solve for TMRCA.
| Mutation
Rates - McDonald values, derived from Sorenson Lee DNA Genweb <http://leedna.com/dnaresults.php?rates=1> 12/2014. |
||||||||||||
| DYS393 | DYS390 | DYS19/394 | DYS19b | DYS391 | DYS385a | DYS385b | DYS426 | DYS388 | DYS439 | DYS389-1 | DYS392 | DYS389-2 |
| 0.0009 | 0.0033 | 0.0015 | 0.0015 | 0.0030 | 0.0018 | 0.0028 | 0.0003 | 0.0004 | 0.0042 | 0.0020 | 0.0011 | 0.0024 |
| DYS458 | DYS459a | DYS459b | DYS455 | DYS454 | DYS447 | DYS437 | DYS448 | DYS449 | ||||
| 0.0053 | 0.0008 | 0.0014 | 0.0003 | 0.0001 | 0.0033 | 0.0014 | 0.0019 | 0.0060 | ||||
| DYS464a | DYS464b | DYS464c | DYS464d | DYS464e | DYS464f | DYS464g | ||||||
| 0.0026 | 0.0030 | 0.0038 | 0.0035 | 0.0035 | 0.0035 | 0.0035 | ||||||
| DYS460 | GATAH4 | YCAIIa | YCAIIb | DYS456 | DYS607 | DYS576 | DYS570 | CDYa | CDYb | DYS442 | DYS438 | |
| 0.0030 | 0.0030 | 0.0008 | 0.0017 | 0.0053 | 0.0056 | 0.0078 | 0.0061 | 0.0101 | 0.0103 | 0.0030 | 0.0009 | |
| Name | Distance | Loci | Rate | Calculations | |||
| 1. Walden Lewis of Spotsylvania Co VA |
Original Line | - | - | # Gen | - | Yr per Gen | Years |
| 2. Taverner Lewis of Spotsylvania Co VA |
Original Line | - | - | - | - | - | - |
| 3. John Lewis of Franklin Co KY |
Original Line | - | - | - | - | - | - |
| 4. Reuben Kennedy of Culpeper Co VA |
Original Line | - | - | - | - | - | - |
| 5. William Young of Page Co VA |
1 mutation | 34 - CDYa | 0.010083861 | 8 | x | 25 | 200 |
| 6. Joseph Lewis of Caroline Co VA |
1 mutation | 34 - CDYa | 0.010083861 | 8 | x | 25 | 200 |
| 7. John Lewis of Caroline Co VA |
1 mutation | 36 - DYS442 | 0.00301618 | 8 | x | 25 | 200 |
| 8. Edmund Lewis of Person Co NC |
1 mutation | 02 - DYS390 | 0.003263219 | 8 | x | 25 | 200 |
| 9. James Lewis of Louisa Co VA |
2 mutations | 33 - DYS570 35 - CDYb |
0.006111277 0.010276061 |
12 | x | 25 | 300 |
| 10. James Lewis of Lincoln Co MO |
2 mutations | 21 - 449 23 - 464b |
0.006024892 0.002973977 |
12 | x | 25 | 300 |
In the last decade, great strides have been made identifying new SNPs down the human genome. And, anthropologists have been able to match these mutations to specific places on the timeline of human history. With this information, we can affix our forefathers to specific times and places in the migration of modern man.
Back when, anthropologists investigated whether R1b1a1a2 [M269], who emerged during the Neolithic Period, was connected to Cro-Magnon Man and the cave paintings of the refugium in southern France. And if connected, Subsequently, M269 could have been the group who followed the retreating ice shield north across the land bridge to Britain and Ireland. With new information gained more recently, those possibilities have been put to rest. The following is updated as of 7/2015:
At the end of the last Ice Age, modern man migrated up the river valleys into central Europe, settling both east and west of the Rhine River in what is now southern Germany and France. From this central location, their descendants emigrated out to the far reaches of Europe. DF27, our forefathers, first settled in what is now northwest Spain c. 2,250 BCE where they developed new technologies and established themselves as a trading nation on the Atlantic coast. And in about 1,000 BCE, our forefathers emigrated first to Ireland and later to Scotland and Wales.
Why was our family in Wales? Was it pressure from the invading Romans or the subsequent pressure from the invading Saxons? And, did our people ex-migrate out of Wales into southern England to the vicinity of Bristol or Wiltshire, England, before coming to America? We do not know.
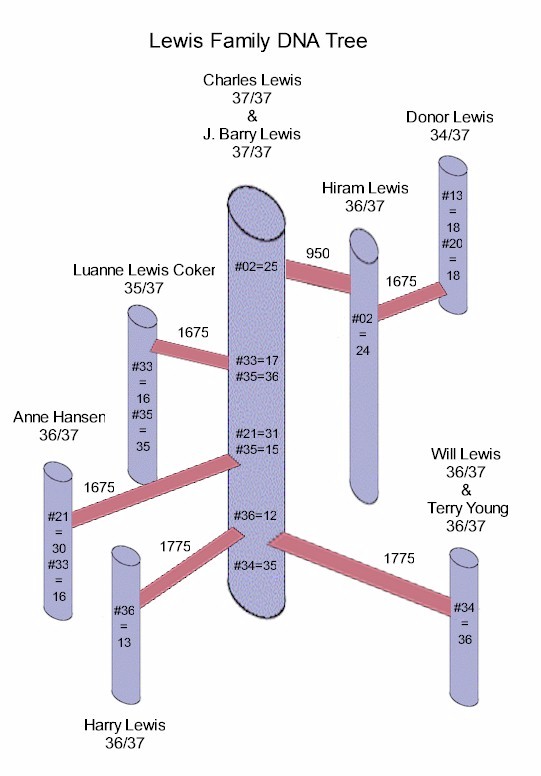
The modern history of our family begins about the time when British colonists--we the Bretons, not the Anglo-Saxon English--braved the Atlantic Ocean to found Jamestown and the Colony of Virginia. In about 1650 or 12 generations ago in Virginia, our Lewis family split when the family of James Lewis of Louisa Co VA and the family of James Lewis of Lincoln Co MO split onto two new branches.
In about 1750 or 8 generations ago in Virginia, the family split again onto three new branches. First the family of Edmund of Person Co NC, then the family of John of Caroline Co VA, and then the families of Joseph Lewis of Caroline Co VA and William Young of Page Co VA split onto individual branches. Note, Joseph Lewis and William Young are the same branch of the family. The question is, "What's their story?"
This leaves the Walden Lewis family of Mississippi and the John Lewis family of Franklin Co KY and now the Rueben Kennedy family of Culpeper Co VA continuing on the original line. Continuing research indicates that the Rueben Kennedy family is also associated with the previously mentioned Joseph Lewis and William Young branch. Again, the question is, "What's their story?" And, the Walden Lewis family has circumstantial evidence which links them to the Lewises of Spotsylvania Co VA.
Note: There are additional tests which could be added. However, this chart illustrates the branches of our Lewis family.
|
|
CE Lewis
Davenport IA
updated 7/11/2015